


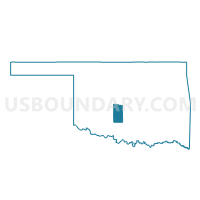
Census Tract 9.03, Grady County, Oklahoma
About
Outline

Summary
| Unique Area Identifier | 485796 |
| Name | Census Tract 9.03 |
| County | Grady County |
| State | Oklahoma |
| Area (square miles) | 40.63 |
| Land Area (square miles) | 40.61 |
| Water Area (square miles) | 0.02 |
| % of Land Area | 99.96 |
| % of Water Area | 0.04 |
| Latitude of the Internal Point | 35.27365540 |
| Longtitude of the Internal Point | -97.71472060 |
| Total Population | 9,327 |
| Total Housing Units | 3,502 |
| Total Households | 3,335 |
| Median Age | 39.9 |
Maps

Graphs
Select a template below for downloading or customizing gragh for Census Tract 9.03, Grady County, Oklahoma


Neighbors
Neighoring Census Tract (by Name) Neighboring Census Tract on the Map
- Census Tract 3014.08, Canadian County, OK
- Census Tract 4001.01, McClain County, OK
- Census Tract 4001.02, McClain County, OK
- Census Tract 8, Grady County, OK
- Census Tract 9.02, Grady County, OK
Top 10 Neighboring County Subdivision (by Population) Neighboring County Subdivision on the Map
- East Canadian CCD, Canadian County, OK (86,541)
- Newcastle-Blanchard CCD, McClain County, OK (15,994)
- Tuttle CCD, Grady County, OK (15,076)
- Amber-Pocasset CCD, Grady County, OK (6,981)
Top 10 Neighboring Place (by Population) Neighboring Place on the Map
- Oklahoma City city, OK (579,999)
- Newcastle city, OK (7,685)
- Blanchard city, OK (7,670)
- Tuttle city, OK (6,019)
- Bridge Creek town, OK (336)
Top 10 Neighboring Unified School District (by Population) Neighboring Unified School District on the Map
- Mustang Public Schools, OK (46,023)
- Tuttle Public Schools, OK (8,069)
- Newcastle Public Schools, OK (7,888)
- Bridge Creek Public Schools, OK (7,737)
Top 10 Neighboring State Legislative District Lower Chamber (by Population) Neighboring State Legislative District Lower Chamber on the Map
- State House District 46, OK (44,285)
- State House District 47, OK (41,973)
- State House District 51, OK (37,430)
- State House District 56, OK (35,524)
Top 10 Neighboring State Legislative District Upper Chamber (by Population) Neighboring State Legislative District Upper Chamber on the Map
- State Senate District 24, OK (98,936)
- State Senate District 45, OK (85,350)
- State Senate District 23, OK (80,676)
Top 10 Neighboring 111th Congressional District (by Population) Neighboring 111th Congressional District on the Map
Top 10 Neighboring 5-Digit ZIP Code Tabulation Area (by Population) Neighboring 5-Digit ZIP Code Tabulation Area on the Map
Explore Neighbors on the MapData
Demographic, Population, Households, and Housing Units
** Data sources from census 2010 **
Show Data on Map
Download Full List as CSV
Download Quick Sheet as CSV
| Subject | This Area | Grady County | Oklahoma | National |
|---|---|---|---|---|
| POPULATION | ||||
| Total Population Map | 9,327 | 52,431 | 3,751,351 | 308,745,538 |
| POPULATION, HISPANIC OR LATINO ORIGIN | ||||
| Not Hispanic or Latino Map | 8,949 | 50,026 | 3,419,344 | 258,267,944 |
| Hispanic or Latino Map | 378 | 2,405 | 332,007 | 50,477,594 |
| POPULATION, RACE | ||||
| White alone Map | 8,314 | 44,994 | 2,706,845 | 223,553,265 |
| Black or African American alone Map | 31 | 1,268 | 277,644 | 38,929,319 |
| American Indian and Alaska Native alone Map | 472 | 2,841 | 321,687 | 2,932,248 |
| Asian alone Map | 27 | 196 | 65,076 | 14,674,252 |
| Native Hawaiian and Other Pacific Islander alone Map | 4 | 36 | 4,369 | 540,013 |
| Some Other Race alone Map | 144 | 792 | 154,409 | 19,107,368 |
| Two or More Races Map | 335 | 2,304 | 221,321 | 9,009,073 |
| POPULATION, SEX | ||||
| Male Map | 4,674 | 26,000 | 1,856,977 | 151,781,326 |
| Female Map | 4,653 | 26,431 | 1,894,374 | 156,964,212 |
| POPULATION, AGE (18 YEARS) | ||||
| 18 years and over Map | 6,915 | 39,257 | 2,821,685 | 234,564,071 |
| Under 18 years | 2,412 | 13,174 | 929,666 | 74,181,467 |
| POPULATION, AGE | ||||
| Under 5 years | 560 | 3,565 | 264,126 | 20,201,362 |
| 5 to 9 years | 689 | 3,645 | 259,336 | 20,348,657 |
| 10 to 14 years | 758 | 3,761 | 253,664 | 20,677,194 |
| 15 to 17 years | 405 | 2,203 | 152,540 | 12,954,254 |
| 18 and 19 years | 231 | 1,445 | 111,944 | 9,086,089 |
| 20 years | 83 | 703 | 56,068 | 4,519,129 |
| 21 years | 72 | 658 | 54,032 | 4,354,294 |
| 22 to 24 years | 202 | 1,724 | 159,142 | 12,712,576 |
| 25 to 29 years | 462 | 3,248 | 265,737 | 21,101,849 |
| 30 to 34 years | 548 | 3,153 | 241,018 | 19,962,099 |
| 35 to 39 years | 670 | 3,283 | 232,742 | 20,179,642 |
| 40 to 44 years | 637 | 3,330 | 228,195 | 20,890,964 |
| 45 to 49 years | 801 | 4,027 | 261,242 | 22,708,591 |
| 50 to 54 years | 815 | 4,023 | 264,369 | 22,298,125 |
| 55 to 59 years | 724 | 3,479 | 235,969 | 19,664,805 |
| 60 and 61 years | 276 | 1,239 | 85,815 | 7,113,727 |
| 62 to 64 years | 373 | 1,783 | 118,698 | 9,704,197 |
| 65 and 66 years | 205 | 1,118 | 68,668 | 5,319,902 |
| 67 to 69 years | 233 | 1,358 | 90,724 | 7,115,361 |
| 70 to 74 years | 311 | 1,797 | 121,075 | 9,278,166 |
| 75 to 79 years | 145 | 1,257 | 95,051 | 7,317,795 |
| 80 to 84 years | 80 | 864 | 69,284 | 5,743,327 |
| 85 years and over | 47 | 768 | 61,912 | 5,493,433 |
| MEDIAN AGE BY SEX | ||||
| Both sexes Map | 39.90 | 38.30 | 36.20 | 37.20 |
| Male Map | 39.40 | 37.20 | 34.90 | 35.80 |
| Female Map | 40.40 | 39.30 | 37.70 | 38.50 |
| HOUSEHOLDS | ||||
| Total Households Map | 3,335 | 19,892 | 1,460,450 | 116,716,292 |
| HOUSEHOLDS, HOUSEHOLD TYPE | ||||
| Family households: Map | 2,817 | 14,535 | 975,267 | 77,538,296 |
| Husband-wife family Map | 2,449 | 11,575 | 722,435 | 56,510,377 |
| Other family: Map | 368 | 2,960 | 252,832 | 21,027,919 |
| Male householder, no wife present Map | 142 | 942 | 73,524 | 5,777,570 |
| Female householder, no husband present Map | 226 | 2,018 | 179,308 | 15,250,349 |
| Nonfamily households: Map | 518 | 5,357 | 485,183 | 39,177,996 |
| Householder living alone Map | 417 | 4,525 | 401,153 | 31,204,909 |
| Householder not living alone Map | 101 | 832 | 84,030 | 7,973,087 |
| HOUSEHOLDS, HISPANIC OR LATINO ORIGIN OF HOUSEHOLDER | ||||
| Not Hispanic or Latino householder: Map | 3,249 | 19,287 | 1,375,637 | 103,254,926 |
| Hispanic or Latino householder: Map | 86 | 605 | 84,813 | 13,461,366 |
| HOUSEHOLDS, RACE OF HOUSEHOLDER | ||||
| Householder who is White alone | 3,069 | 17,623 | 1,126,295 | 89,754,352 |
| Householder who is Black or African American alone | 9 | 463 | 105,046 | 14,129,983 |
| Householder who is American Indian and Alaska Native alone | 138 | 921 | 104,630 | 939,707 |
| Householder who is Asian alone | 9 | 53 | 20,120 | 4,632,164 |
| Householder who is Native Hawaiian and Other Pacific Islander alone | 1 | 14 | 1,191 | 143,932 |
| Householder who is Some Other Race alone | 34 | 228 | 41,632 | 4,916,427 |
| Householder who is Two or More Races | 75 | 590 | 61,536 | 2,199,727 |
| HOUSEHOLDS, HOUSEHOLD TYPE BY HOUSEHOLD SIZE | ||||
| Family households: Map | 2,817 | 14,535 | 975,267 | 77,538,296 |
| 2-person household Map | 1,276 | 6,517 | 434,417 | 31,882,616 |
| 3-person household Map | 589 | 3,287 | 219,620 | 17,765,829 |
| 4-person household Map | 571 | 2,796 | 178,628 | 15,214,075 |
| 5-person household Map | 253 | 1,213 | 87,900 | 7,411,997 |
| 6-person household Map | 96 | 491 | 34,017 | 3,026,278 |
| 7-or-more-person household Map | 32 | 231 | 20,685 | 2,237,501 |
| Nonfamily households: Map | 518 | 5,357 | 485,183 | 39,177,996 |
| 1-person household Map | 417 | 4,525 | 401,153 | 31,204,909 |
| 2-person household Map | 89 | 652 | 68,240 | 6,360,012 |
| 3-person household Map | 8 | 92 | 10,338 | 992,156 |
| 4-person household Map | 4 | 79 | 3,939 | 411,171 |
| 5-person household Map | 0 | 5 | 993 | 126,634 |
| 6-person household Map | 0 | 4 | 326 | 48,421 |
| 7-or-more-person household Map | 0 | 0 | 194 | 34,693 |
| HOUSING UNITS | ||||
| Total Housing Units Map | 3,502 | 22,219 | 1,664,378 | 131,704,730 |
| HOUSING UNITS, OCCUPANCY STATUS | ||||
| Occupied Map | 3,335 | 19,892 | 1,460,450 | 116,716,292 |
| Vacant Map | 167 | 2,327 | 203,928 | 14,988,438 |
| HOUSING UNITS, OCCUPIED, TENURE | ||||
| Owned with a mortgage or a loan Map | 2,274 | 9,466 | 611,266 | 52,979,430 |
| Owned free and clear Map | 760 | 5,667 | 370,494 | 23,006,644 |
| Renter occupied Map | 301 | 4,759 | 478,690 | 40,730,218 |
| HOUSING UNITS, VACANT, VACANCY STATUS | ||||
| For rent Map | 21 | 604 | 59,264 | 4,137,567 |
| Rented, not occupied Map | 0 | 29 | 2,717 | 206,825 |
| For sale only Map | 51 | 289 | 22,671 | 1,896,796 |
| Sold, not occupied Map | 14 | 186 | 8,405 | 421,032 |
| For seasonal, recreational, or occasional use Map | 15 | 118 | 35,187 | 4,649,298 |
| For migrant workers Map | 0 | 7 | 318 | 24,161 |
| Other vacant Map | 66 | 1,094 | 75,366 | 3,652,759 |
| HOUSING UNITS, OCCUPIED, AVERAGE HOUSEHOLD SIZE BY TENURE | ||||
| Total: Map | 2.80 | 2.58 | 2.49 | 2.58 |
| Owner occupied Map | 2.79 | 2.62 | 2.54 | 2.65 |
| Renter occupied Map | 2.87 | 2.45 | 2.38 | 2.44 |
| HOUSING UNITS, OCCUPIED, TENURE BY RACE OF HOUSEHOLDER | ||||
| Owner occupied: Map | 3,034 | 15,133 | 981,760 | 75,986,074 |
| Householder who is White alone Map | 2,817 | 13,661 | 802,001 | 63,446,275 |
| Householder who is Black or African American alone Map | 7 | 238 | 43,781 | 6,261,464 |
| Householder who is American Indian and Alaska Native alone Map | 113 | 649 | 67,547 | 509,588 |
| Householder who is Asian alone Map | 8 | 36 | 11,960 | 2,688,861 |
| Householder who is Native Hawaiian and Other Pacific Islander alone Map | 0 | 8 | 446 | 61,911 |
| Householder who is Some Other Race alone Map | 27 | 129 | 19,101 | 1,975,817 |
| Householder who is Two or More Races Map | 62 | 412 | 36,924 | 1,042,158 |
| Renter occupied: Map | 301 | 4,759 | 478,690 | 40,730,218 |
| Householder who is White alone Map | 252 | 3,962 | 324,294 | 26,308,077 |
| Householder who is Black or African American alone Map | 2 | 225 | 61,265 | 7,868,519 |
| Householder who is American Indian and Alaska Native alone Map | 25 | 272 | 37,083 | 430,119 |
| Householder who is Asian alone Map | 1 | 17 | 8,160 | 1,943,303 |
| Householder who is Native Hawaiian and Other Pacific Islander alone Map | 1 | 6 | 745 | 82,021 |
| Householder who is Some Other Race alone Map | 7 | 99 | 22,531 | 2,940,610 |
| Householder who is Two or More Races Map | 13 | 178 | 24,612 | 1,157,569 |
| HOUSING UNITS, OCCUPIED, TENURE BY HISPANIC OR LATINO ORIGIN OF HOUSEHOLDER | ||||
| Owner occupied: Map | 3,034 | 15,133 | 981,760 | 75,986,074 |
| Not Hispanic or Latino householder Map | 2,961 | 14,798 | 940,332 | 69,617,625 |
| Hispanic or Latino householder Map | 73 | 335 | 41,428 | 6,368,449 |
| Renter occupied: Map | 301 | 4,759 | 478,690 | 40,730,218 |
| Not Hispanic or Latino householder Map | 288 | 4,489 | 435,305 | 33,637,301 |
| Hispanic or Latino householder Map | 13 | 270 | 43,385 | 7,092,917 |
| HOUSING UNITS, OCCUPIED, TENURE BY HOUSEHOLD SIZE | ||||
| Owner occupied: Map | 3,034 | 15,133 | 981,760 | 75,986,074 |
| 1-person household Map | 352 | 2,868 | 222,740 | 16,453,569 |
| 2-person household Map | 1,278 | 5,986 | 379,461 | 27,618,605 |
| 3-person household Map | 553 | 2,594 | 156,161 | 12,517,563 |
| 4-person household Map | 519 | 2,207 | 127,864 | 10,998,793 |
| 5-person household Map | 221 | 939 | 59,965 | 5,057,765 |
| 6-person household Map | 84 | 371 | 22,494 | 1,965,796 |
| 7-or-more-person household Map | 27 | 168 | 13,075 | 1,373,983 |
| Renter occupied: Map | 301 | 4,759 | 478,690 | 40,730,218 |
| 1-person household Map | 65 | 1,657 | 178,413 | 14,751,340 |
| 2-person household Map | 87 | 1,183 | 123,196 | 10,624,023 |
| 3-person household Map | 44 | 785 | 73,797 | 6,240,422 |
| 4-person household Map | 56 | 668 | 54,703 | 4,626,453 |
| 5-person household Map | 32 | 279 | 28,928 | 2,480,866 |
| 6-person household Map | 12 | 124 | 11,849 | 1,108,903 |
| 7-or-more-person household Map | 5 | 63 | 7,804 | 898,211 |
Loading...